Global data center capacity is on track to roughly double to about 200 gigawatts by the end of the decade, adding some 97 gigawatts of new capacity, and the market behind it is growing about 11% a year by revenue, with capacity expanding faster, near 14%. Artificial intelligence, cloud adoption, and a record wave of construction are pushing capacity, investment, and demand to levels the industry has never planned for. The statistics below break down how fast data centers are growing, where the capacity is landing, and who is paying for it.
Citation Policy: These statistics are free to reference and reuse, including for commercial work. The Network Installers asks only that you credit the original source named alongside each figure and link back to this page when you cite our compilation.
Key Takeaways
- Global data center capacity is set to roughly double by 2030, adding about 97 GW to reach about 200 GW (JLL).
- The global market was worth roughly $270 billion to $387 billion in 2025 and is growing about 11% a year by revenue (Fortune Business Insights, Precedence Research).
- Hyperscale operators control about 48% of the world’s data center capacity today, projected to reach 67% by 2031 (Synergy Research Group).
- 1,360 hyperscale data centers were operating worldwide at the end of 2025 (Synergy Research Group).
- North American vacancy hit an all-time low near 1.6%, with nearly all capacity under construction already pre-committed (CBRE, JLL).
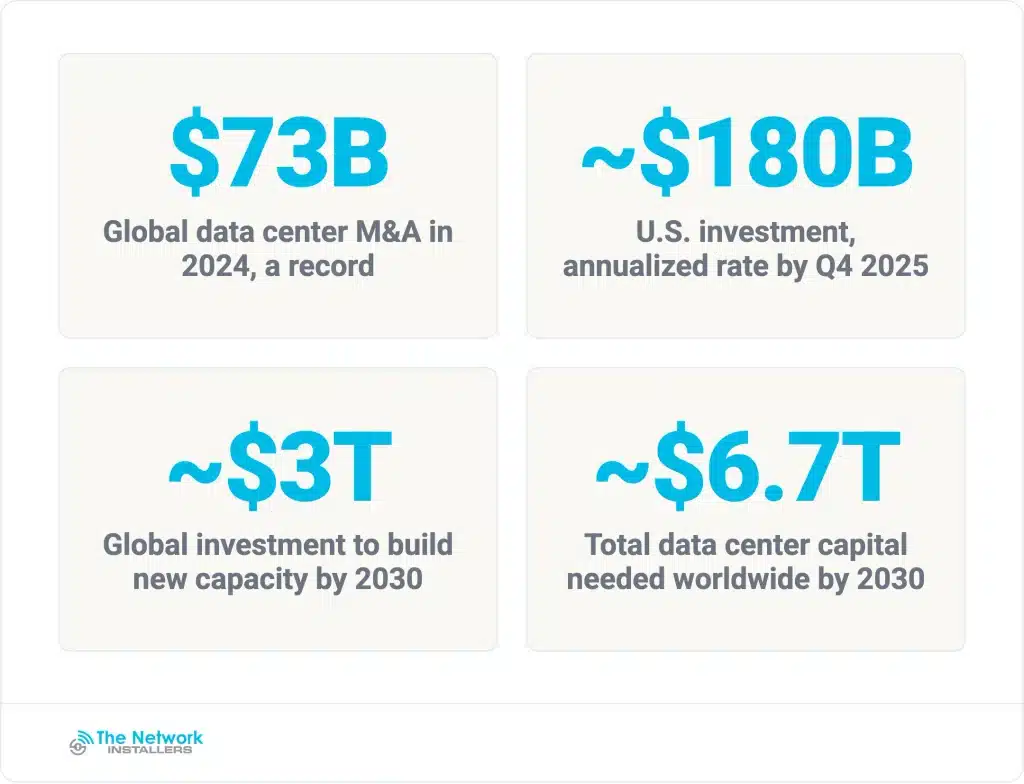
- Data center M&A set a record $73 billion globally in 2024, with private equity behind 80% to 90% of the value (Synergy Research Group).
- Northern Virginia is the largest U.S. market, holding roughly 13% of the world’s operational data center capacity (Weldon Cooper Center).
Data Center Market Size and Growth Rate
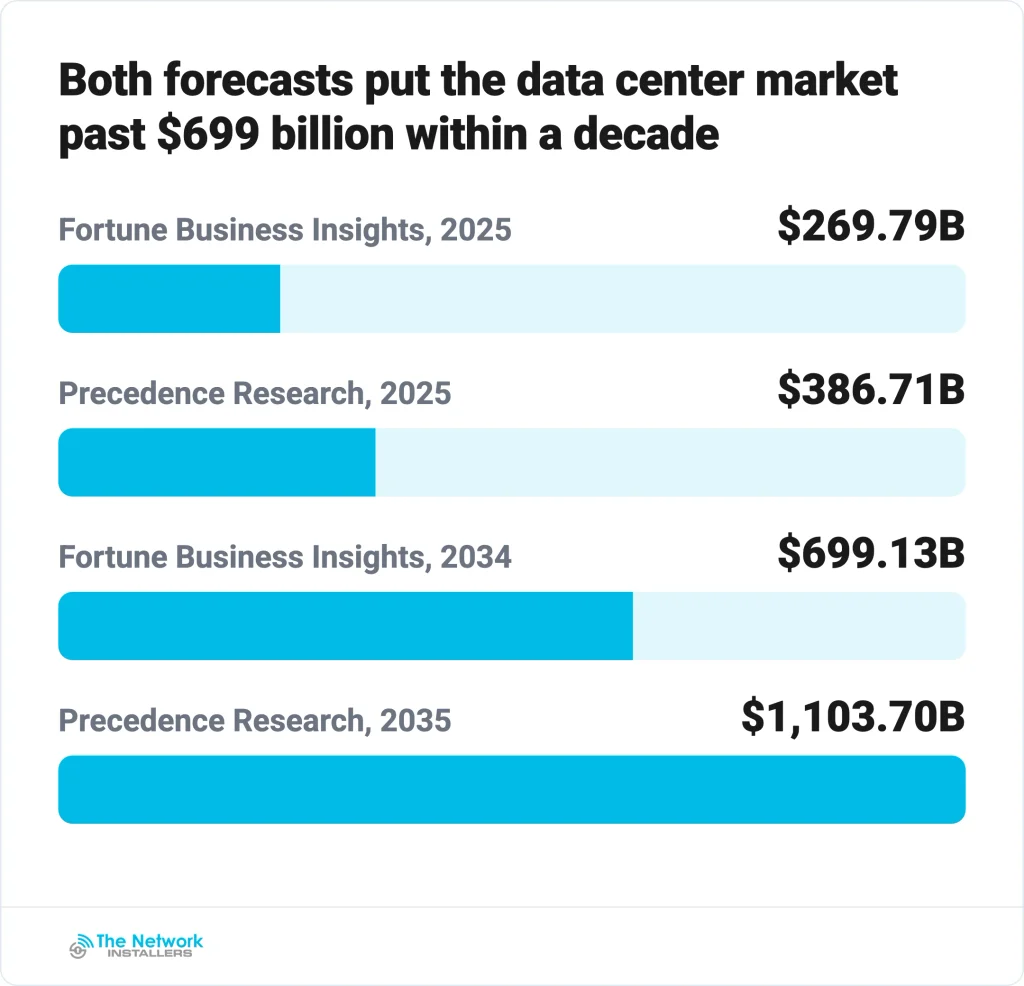
The global data center market is worth several hundred billion dollars and growing at a double-digit annual rate, though the exact figure depends on which research firm you ask, because each defines the market differently.
| Research firm | Market size (2025) | Projected size | CAGR | North America share |
|---|---|---|---|---|
| Fortune Business Insights | $269.79 billion | $699.13 billion by 2034 | 11.10% | 38.5% |
| Precedence Research | $386.71 billion | ~$1,103.70 billion by 2035 | 11.06% | 41% |
Sources: Fortune Business Insights and Precedence Research, as of 2025.
North America holds the largest regional share of the global data center market, between 38.5% and 41% by these two estimates, worth about $103.87 billion in 2025 according to Fortune Business Insights.
Data Center Capacity Growth
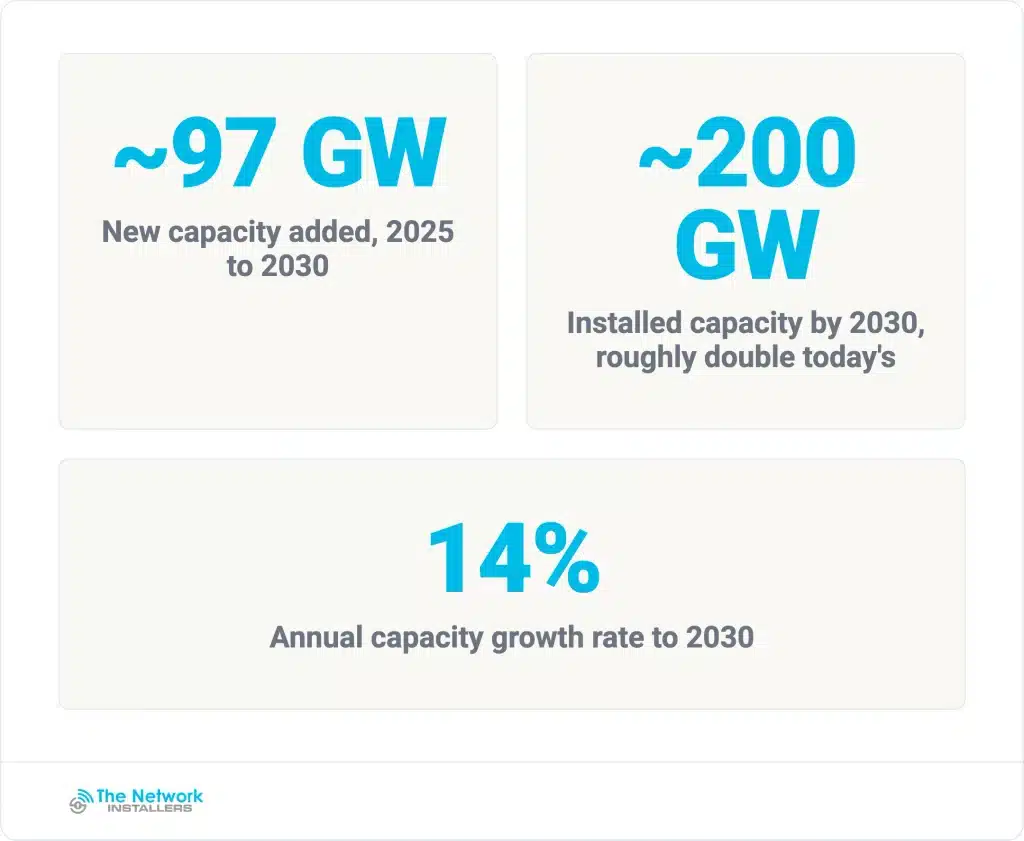
Measured in power rather than dollars, data center capacity is on a path to roughly double by the end of the decade, adding about as much new capacity in five years as exists in the entire sector today.
| Global capacity measure | Figure |
|---|---|
| New capacity added, 2025 to 2030 | ~97 GW |
| Installed capacity by 2030 (projected) | ~200 GW, roughly double today’s |
| Annual growth rate to 2030 | 14% CAGR |
Source: JLL Global Data Center Outlook.
Growth is not evenly spread across the world. The Americas hold the largest share of capacity and are also growing fastest.
| Region | Share or capacity | Growth rate to 2030 |
|---|---|---|
| Americas | ~50% of global capacity (U.S. is ~90% of it) | ~17% CAGR |
| Asia Pacific | 32 GW growing to 57 GW | ~12% CAGR |
| Europe, Middle East, Africa | adding ~13 GW | ~10% CAGR |
Source: JLL Global Data Center Outlook.
How Many Data Centers Are There, and How Fast Is the Count Growing
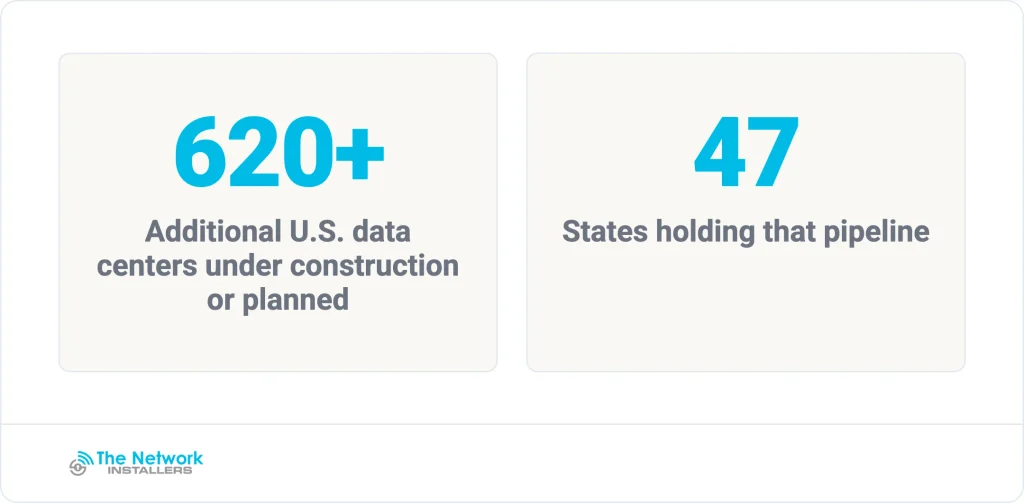
The United States hosts more data centers than any other country, and its construction pipeline runs into the hundreds of facilities. More than 620 additional U.S. data centers are under construction or planned across 47 states, per the Electric Choice data center tracker, representing tens of gigawatts of new capacity.
For a state-by-state view of where these facilities cluster, see the states with the most data centers breakdown.
Hyperscale Data Center Growth
Hyperscale operators, the largest cloud and AI providers, are the fastest-growing segment and now own nearly half of all data center capacity, with both their count and their share still climbing.
| Period | Hyperscale data centers worldwide |
|---|---|
| End of 2024 | 1,136 |
| Third quarter 2025 | 1,297 |
| End of 2025 | 1,360 |
Source: Synergy Research Group, compiled from three successive census updates: the 1,136 count, the 1,297 count, and the 1,360 count. All track the same measure, the number of large hyperscale-operated data centers.
Hyperscale operators are also taking a larger share of total capacity, and the United States dominates that footprint.
| Hyperscale capacity measure | Figure |
|---|---|
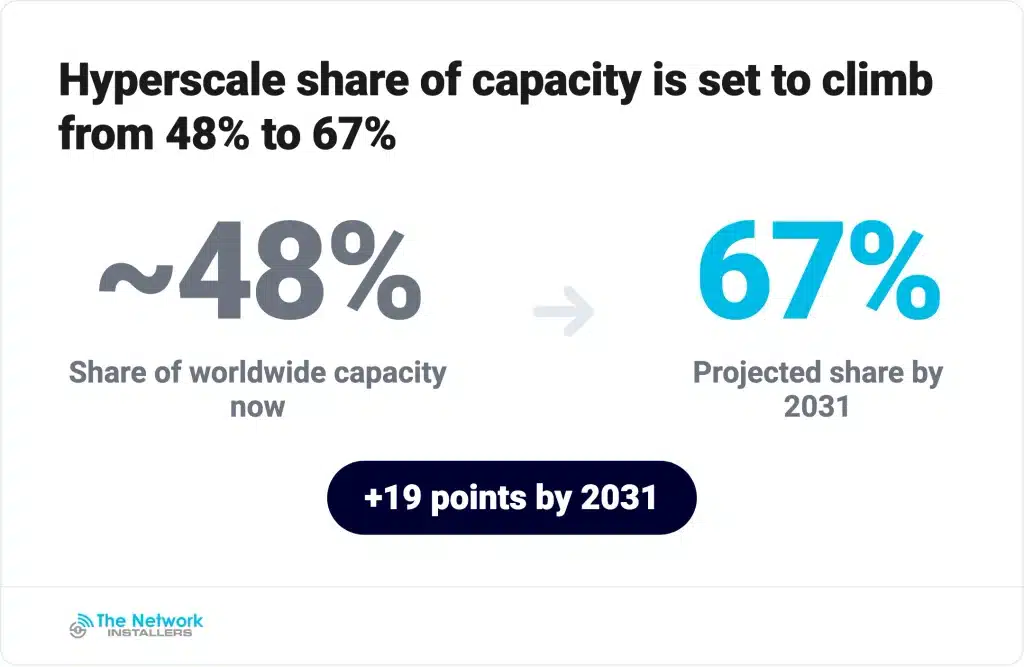
| Share of worldwide data center capacity, now | ~48% |
| Share of worldwide data center capacity, 2031 (projected) | 67% |
| U.S. share of worldwide hyperscale capacity | ~55% (up from 52% three years earlier) |
Source: Synergy Research Group.
Colocation Growth: Vacancy, Preleasing, and Absorption
Colocation providers, which lease data center space to tenants, are running out of room as demand outpaces new supply. Net absorption, the amount of capacity leased and occupied, set a record in 2025.
| Period | U.S. data center net absorption |
|---|---|
| 2024 | 1,809.5 MW |
| 2025 | 2,497.6 MW |
| First half 2026 | 1,456 MW |
Source: CBRE North America Data Center Trends. The 2024 and 2025 figures come from CBRE’s year-end report; the first-half 2026 figure from CBRE’s mid-year report. All use the same net-absorption measure.
The scramble for space shows up in vacancy, preleasing, and rent figures that all point the same way.
| North American colocation measure | Figure |
|---|---|
| Vacancy, first half 2025 | ~1.6% (all-time low) |
| Capacity under construction preleased, end of 2025 | nearly all, pre-committed to investment-grade tenants |
| Colocation rent growth since 2020 | ~60% |
Sources: vacancy from CBRE; preleasing and rent growth from the JLL North America data center report.
Data Center Investment and M&A Growth
The capital flowing into data centers has grown into the trillions, and dealmaking set records in 2024.
| Investment measure | Figure |
|---|---|
| U.S. investment in data center structures, 2021 to 2025 | roughly quadrupled |
| Aggregate U.S. data center investment, annualized rate by Q4 2025 | ~$180 billion |
| Global investment to build new capacity by 2030 | ~$3 trillion |
| Total data center capital needed worldwide by 2030 | ~$6.7 trillion |
| Global data center M&A value, 2024 | $73 billion (record) |
| Private equity share of that global M&A value | 80% to 90% |
Sources: U.S. structures investment and the ~$180 billion aggregate rate from the Federal Reserve; the ~$3 trillion global buildout figure from JLL; the ~$6.7 trillion total from Fortune; and the global M&A value and private-equity share from Synergy Research Group.
Where U.S. Data Center Growth Is Concentrated
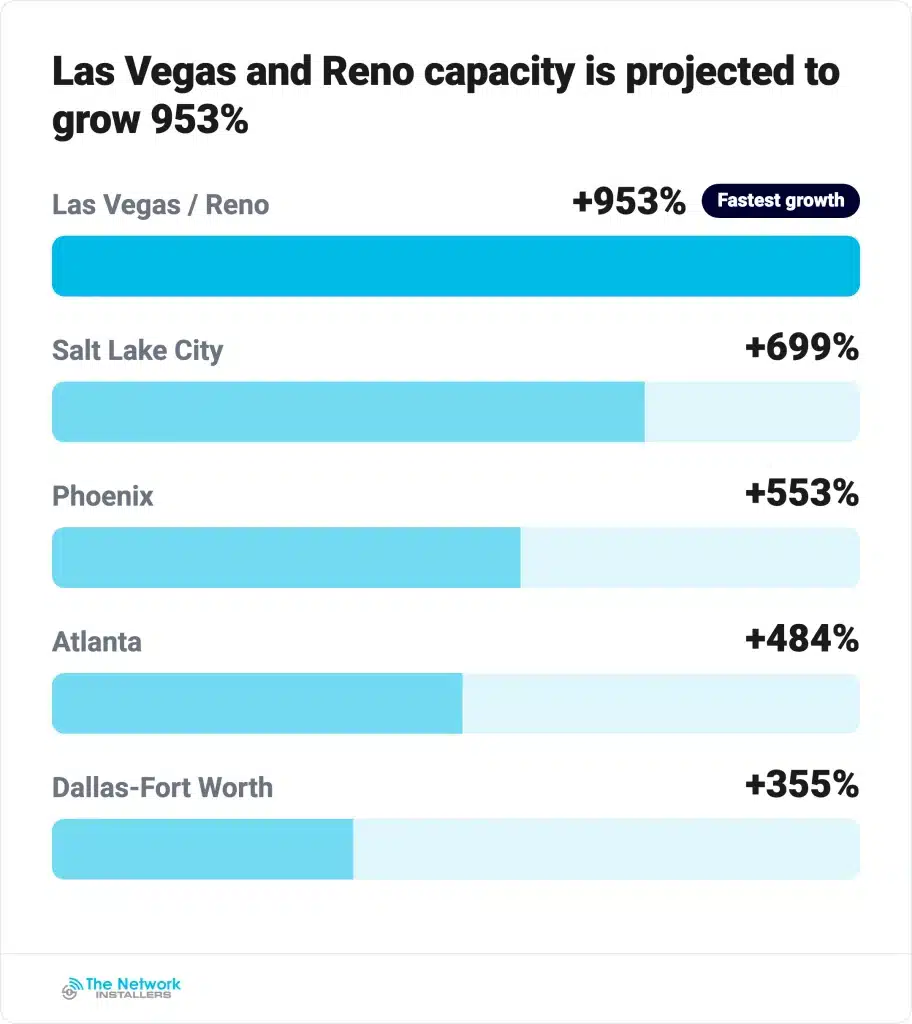
Data center growth clusters in a handful of metros. Northern Virginia is the largest U.S. market by a wide margin. Beyond it, newer hubs are expanding off a much smaller base at triple-digit rates, projected capacity and growth shown below.
| U.S. hub | Projected capacity | Growth rate |
|---|---|---|
| Phoenix | 5,340 MW | +553% |
| Dallas-Fort Worth | 4,396 MW | +355% |
| Las Vegas / Reno | 3,812 MW | +953% |
| Atlanta | 3,125 MW | +484% |
| Salt Lake City | 1,271 MW | +699% |
Source: Upwind analysis of JLL data, 2024.
Northern Virginia alone holds about 13% of the world’s operational data center capacity and 25% of the Americas’, according to a Virginia JLARC study summarized by the Weldon Cooper Center.
The Economic Impact of Data Center Growth
Data center growth reaches beyond the industry into local construction, jobs, and tax revenue.
| Impact of a typical U.S. data center | Figure |
|---|---|
| Construction jobs supported while being built | ~1,688 |
| Construction wages paid | ~$77.7 million |
| Permanent jobs once operating | 157 |
| Annual permanent wages | ~$7.8 million |
| Annual contribution to the local economy | ~$32.5 million |
Source: U.S. Chamber of Commerce per-facility economic-impact analysis; figures are averages, not year-specific.
Skilled-labor availability has become one of the main constraints on how fast new capacity can come online, and it is a growing focus for operators planning large campuses.
Frequently Asked Questions
How quickly are data centers growing?
Global data center capacity is projected to grow at about a 14% compound annual rate through 2030, roughly doubling to about 200 gigawatts as some 97 gigawatts of new capacity comes online, according to JLL. Measured in revenue rather than capacity, the market is growing at about 11% a year, per Fortune Business Insights and Precedence Research. Both measures put the sector among the fastest-growing categories of physical infrastructure.
Is data center growth slowing down?
There is no sign of a slowdown in the current data. North American net absorption set a record in 2025, vacancy fell to an all-time low near 1.6%, and nearly all capacity under construction was already pre-committed to tenants at year-end, according to CBRE and JLL. The main brake on growth is supply, not demand, with power availability and construction timelines the binding constraints rather than a lack of tenants.
Why are data centers growing so fast?
Artificial intelligence and cloud computing are the primary drivers. Building the capacity to serve AI is capital-intensive: total data center capital needs run to about $6.7 trillion worldwide by 2030, according to Fortune. Cloud adoption and enterprise digital transformation add steady baseline demand on top of the AI surge.
What is the biggest problem for data center growth?
Access to electrical power and the pace of new construction are the biggest constraints on data center growth. Demand is running ahead of supply, which is why North American vacancy sits near record lows and nearly all new capacity is pre-committed before it opens. The energy demand behind this growth is covered in detail separately, as is the construction market that has to keep pace.
The Bottom Line
Data center growth has moved from a niche facilities trend to a national infrastructure story. Capacity is set to roughly double by 2030, hyperscale operators are pulling ahead, colocation space is scarce, and investment has climbed into the trillions. For businesses planning on-premises, colocation, or new-build projects, the practical lesson is that capacity is tight and lead times are long, so infrastructure planning has to start early.
The Network Installers is a commercial network cabling and infrastructure company that has served more than 20,000 locations over 19-plus years, designing and installing the structured cabling, fiber, and pathway that data-heavy environments depend on. As density rises, the cabling and pathway decisions made early determine how much capacity a room can ever hold, which is why our data center cabling guide and structured cabling pricing breakdown start with the infrastructure, not the equipment. If you are planning a data-heavy buildout, get in touch to scope the cabling and pathway design.
Sources
- Fortune Business Insights: Data Center Market Size Report
- Precedence Research: Data Center Market Size and Forecast
- JLL: Global Data Center Market Outlook
- Electric Choice: U.S. Data Center Tracker
- Synergy Research Group: Hyperscale Operators to Account for 67% of Data Center Capacity
- Synergy Research Group: Hyperscale Spending Spree Drives Data Center Capacity Growth
- Synergy Research Group: Hyperscale Data Center Count Hits 1,136
- Synergy Research Group: Data Center M&A Deals Broke All Records
- CBRE: North American Data Center Market Set Records
- CBRE: North American Data Center Demand Continues to Outpace Supply
- CBRE: North America Data Center Trends, First Half
- JLL: North America Data Center Report
- Federal Reserve: Data Center Investment and the U.S. Economy
- Fortune: Data Centers Are Eating the Economy
- Upwind: U.S. Data Center Powerhouses
- Weldon Cooper Center: JLARC Report on Data Centers in Virginia
- U.S. Chamber of Commerce: Data Centers Create Jobs and Opportunities Nationwide